(Note: the table and figure were not included in the version published in Local Transport Today)
In
my home city of Bristol, critics of the Cycling City
programme have been confounded by a two-thirds increase in the modal
share of
cycling. London has
also seen a similar
increase in cycling, but from a lower base.
High rates of cycling are concentrated in a few Inner
London boroughs plus
the one outer borough of Richmond-upon-Thames.
|
Driving |
Passenger |
Bus |
Train/Metro |
Cycle |
Walk |
|
|
England
2011 |
60.1% |
5.5% |
8.2% |
10.2% |
3.2% |
10.9% |
|
England 2001 |
60.5% |
6.7% |
8.3% |
8.1% |
3.1% |
11.0% |
|
London 2011 |
29.1% |
1.9% |
15.0% |
38.4% |
4.3% |
9.0% |
|
London 2001 |
36.7% |
2.7% |
12.2% |
33.9% |
2.5% |
9.2% |
|
Bristol
2011 |
51.9% |
5.2% |
10.3% |
2.2% |
8.2% |
20.2% |
|
Bristol 2001 |
54.6% |
6.8% |
13.6% |
1.0% |
4.9% |
16.8% |
|
Sustainable Travel Demonstration Towns |
||||||
|
Darlington
2011 |
64.6% |
7.4% |
7.5% |
1.9% |
2.6% |
14.0% |
|
Darlington 2001 |
61.1% |
8.8% |
11.1% |
1.3% |
2.4% |
12.9% |
|
Peterborough
2011 |
62.7% |
9.3% |
8.0% |
2.7% |
6.2% |
9.3% |
|
Peterborough 2001 |
62.4% |
8.5% |
7.1% |
2.4% |
8.3% |
9.2% |
|
Worcester
2011 |
64.1% |
6.2% |
4.9% |
2.0% |
4.6% |
16.7% |
|
Worcester 2001 |
63.0% |
7.7% |
4.9% |
1.5% |
5.1% |
15.9% |
(From
Census Table
CT0015. Home workers, non-workers and other modes excluded)
More
worryingly, the three Sustainable Travel Demonstration
Towns (STDT) Darlington, Peterborough and Worcester have all bucked the
national trend, registering increases in the share of driving to work. The English STDT programme
which ran from
2004 until 2008 was one of the biggest smarter travel experiments
conducted
internationally. Each of the three towns took
a slightly
different approach, but area-wide personalised travel planning was
central to
all of them. The
evaluation study commissioned
by the DfT (Sloman et al 2010) concluded that the programme had been a
success,
with car trips falling by 9% across the three towns, mainly due to
modal shift.
LTT
readers may remember the controversy last year about the
DfT’s treatment of smarter choices in its WebTAG guidance (Issue 598). Implicitly repudiating the
findings of its
own study, the DfT’s modellers opted for scepticism, downplaying the
likely
impact of smarter travel measures.
This
prompted the Campaign for Better Transport to publish alternative
guidance,
using more optimistic assumptions consistent with the various
evaluation
studies.
Central
to that debate was a difference of opinion about the
reliability of ‘before and after’ evaluation studies.
Many studies worldwide have attributed
significant changes in travel behaviour to smarter choices (or
‘Voluntary
Travel Behavior Change’). Most
of these
have relied heavily on before and after surveys.
An influential strand in the academic
literature has questioned the reliability of such methods. However carefully the data
is collected, the
responses may be vulnerable to several types of bias, particularly
social
approval bias and differential response bias i.e. those people who have
a
positive change to report are more likely to respond to a survey than
those who
feel the whole thing has been a waste of time.
Face to face collection methods may minimise the latter,
but increase
the risk of social approval bias.
These
problems may afflict survey-based evaluations of any transport change,
but
those involving social marketing are likely to be particularly
vulnerable: more
so in the ‘after’ surveys than the ‘befores’.
As the evaluations are generally trying to measure small
differences
between two larger figures, even a small bias can significantly skew
the
results.
It
is easy to demonstrate some of these biases in laboratory
situations but how significant are they in practice? This is a
difficult
question to answer: it would require a comparison between survey
responses and
“the right answers” obtained by other, more ‘objective’ methods. Traffic flows are often
measured as well and
they usually ‘tell a different story’.
In the STDT evaluation the traffic counts showed smaller
reductions than
the surveys suggested. The
authors
attributed these differences to a range of local factors such as
population
growth and differences between local and externally-generated traffic. Other studies worldwide
have referred to
issues such as weather conditions on the data collection days. As the surveys and traffic
counts are not
measuring the same things, it is difficult to say with any confidence
whether
the survey measures are telling a true story or not.
The
STDT evaluation showed relatively small changes in
commuting by residents of the three towns.
The modal share of driving fell by 3% in Darlington and
Peterborough,
with no change in Worcester. In
estimating the cost benefit ratios of the STDT programme, Cairns et al
estimated that the effects of the changes would ‘decay’ at a rate of
40% a year
once the programme finished, so we wouldn’t expect much effect to
remain by the
time of the Census. Many
other factors
could have contributed to those increases in driving, which might have
been
greater if the STDT had never happened.
But the simple fact that driving went up may, nonetheless,
strengthen
the hand of the sceptics in the DfT and the Treasury.
The
English STDTs were followed by similar programmes in
Scotland and most recently in the Republic of Ireland, where
implementation
began in Limerick, Dungarvan and Westport last year.
UWE was part of a consortium led by Irish
consultants Transport and Innovation, which bid for the evaluation of
that 5
year programme. The
tender feedback
showed that we scored highly on methodology but narrowly lost out on
price (a
familiar experience to any of you?)
Amongst the ideas we proposed in that tender was one which
could have
helped to resolve those lingering uncertainties about the reliability
of before
and after surveys.
Academics
sometimes jealously guard their untried ideas, but
as we didn’t get the chance on that occasion, I would like to hear from
anyone who
might be interested in trying the following idea in a real situation. This could relate to
smarter choices or any
other change in travel behaviour over time.
The first step is to identify self-contained networks of residential streets, where all movements in and out can be measured by trip counters or manual observations. Most towns and cities do have such areas, like the ones below which we identified in Dungarvan.
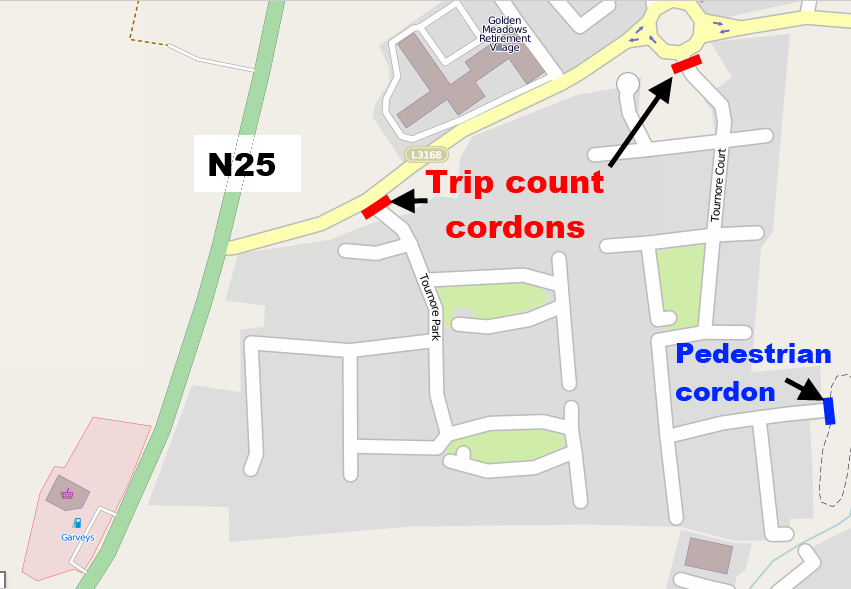
DUNGARVAN MAP (From Open Street
Maps)
Their
populations may not be typical of the whole town, but
that does not necessarily matter.
Within
those areas a higher concentration of households will be asked the same
questions as households across the rest of the town.
These must ask about visitors and deliveries
as well as trips by household members.
The traffic counts should cover the same time periods as
the survey
responses, so self-reported trips can be compared to the traffic
movements. The two
measures are unlikely
to yield exactly the same results.
If we
assume the trip counters measure ‘actual trips’, the key question is
whether
the ratio of reported to actual trips significantly changes between the
before
and the after survey. If
it does, then
adjustments can be made to the findings for the whole town. The devil is often in the
detail when
designing a research study: there would be several practical
challenges, but
none of them seems insurmountable.
Which
modes can be compared in this way would depend on the trip recording
methods:
even if limited to cars and delivery vehicles, it could still help to
verify
the validity of the survey.
Accurately
measuring behaviour change is one challenge.
Explaining the causes is a tougher one.
Why was the Cycling City in Bristol
apparently so much more successful than the STDT programme? It would be
interesting to hear the views of transport planners working in those
three
towns. A number of
studies are looking
at different aspects of cycling in Bristol, which may reveal more. In the meantime, some more
general, and
fundamental, comments can be made.
The
Cycling City programme in Bristol spent considerably
more on infrastructure than marketing.
It accelerated a programme of cycle route construction
already underway,
which is continuing in several places across the West of England area
at the
moment. Much of the
marketing effort was
aimed at promoting these routes, which have gradually joined up to
create one
of the most comprehensive radial networks of any British City. From where I live in the
Centre, I can now
leave the city on cycle routes in six directions: not all off-road, but
joined-up and avoiding heavy traffic.
The design quality is variable – Copenhagen or Groningen
it ain’t – but the
network has created many useful short-cuts for cyclists and pedestrians. For all its faults, I have
watched a growing
number of cyclists and pedestrians using these routes, particularly at
peak
times: the trip counts on one of the most improved routes doubled
during the
Cycling City programme. Some
of the
marketing did help spread awareness of these routes, though much still
remains
to be done in that respect.
Part
of the credit must be given to First Group, for pricing
people off their buses (recently acknowledged with a ‘fares
consultation and
review’ launched under political pressure).
But the fall in bus use is only part of the story: walking
has increased
and car driving has also fallen. Congestion is a problem for cars and
buses, but
a long-standing one: average traffic speeds have been increasing in
recent
years. And I have
witnessed the growth
amongst certain segments of Bristol’s population of a ‘cycling culture’. As one participant in a
focus group put it:
“cycling is not seen as bizarre in Bristol”.
Several analysts of cycling in Northern Europe (e.g.
Pucher, Buelher,
Hembrow) have described how cycling cultures have developed in
countries and
cities where sustained improvements have been made to cycling
infrastructure. To
prove what caused what (or calculate meaningful
cost-benefit ratios) would be impossible, but to surmise that each
reinforced
the other is probably a safe bet.
There
is a broader lesson here for smarter choices and modal
shift. Social
marketing can help to
foster, or accelerate transport cultures of one kind or another. But marketing is about
more than information
or persuasion: it is also about the nature of the product itself. Marketing a useless
product is a waste of
time and money. Fostering
cultural
change where conditions are improving is the only way smarter choices
will work
in the longer-term. If
commissioners of
research are interested in achieving
value for money, rather than simply estimating it, then understanding
how to
foster those changes would be more useful than obsessing about
cost-benefit
ratios for measures which may be impossible to disentangle.